In real estate there are three important words that all aspiring agents need to know, understand and live by: location, location, location! The location of a property makes or breaks a sale.
For analysts, economists, business owners, regulators, associations, governments, farmers and ranchers and others, there are three important words to know, understand and live by: data, data, data!
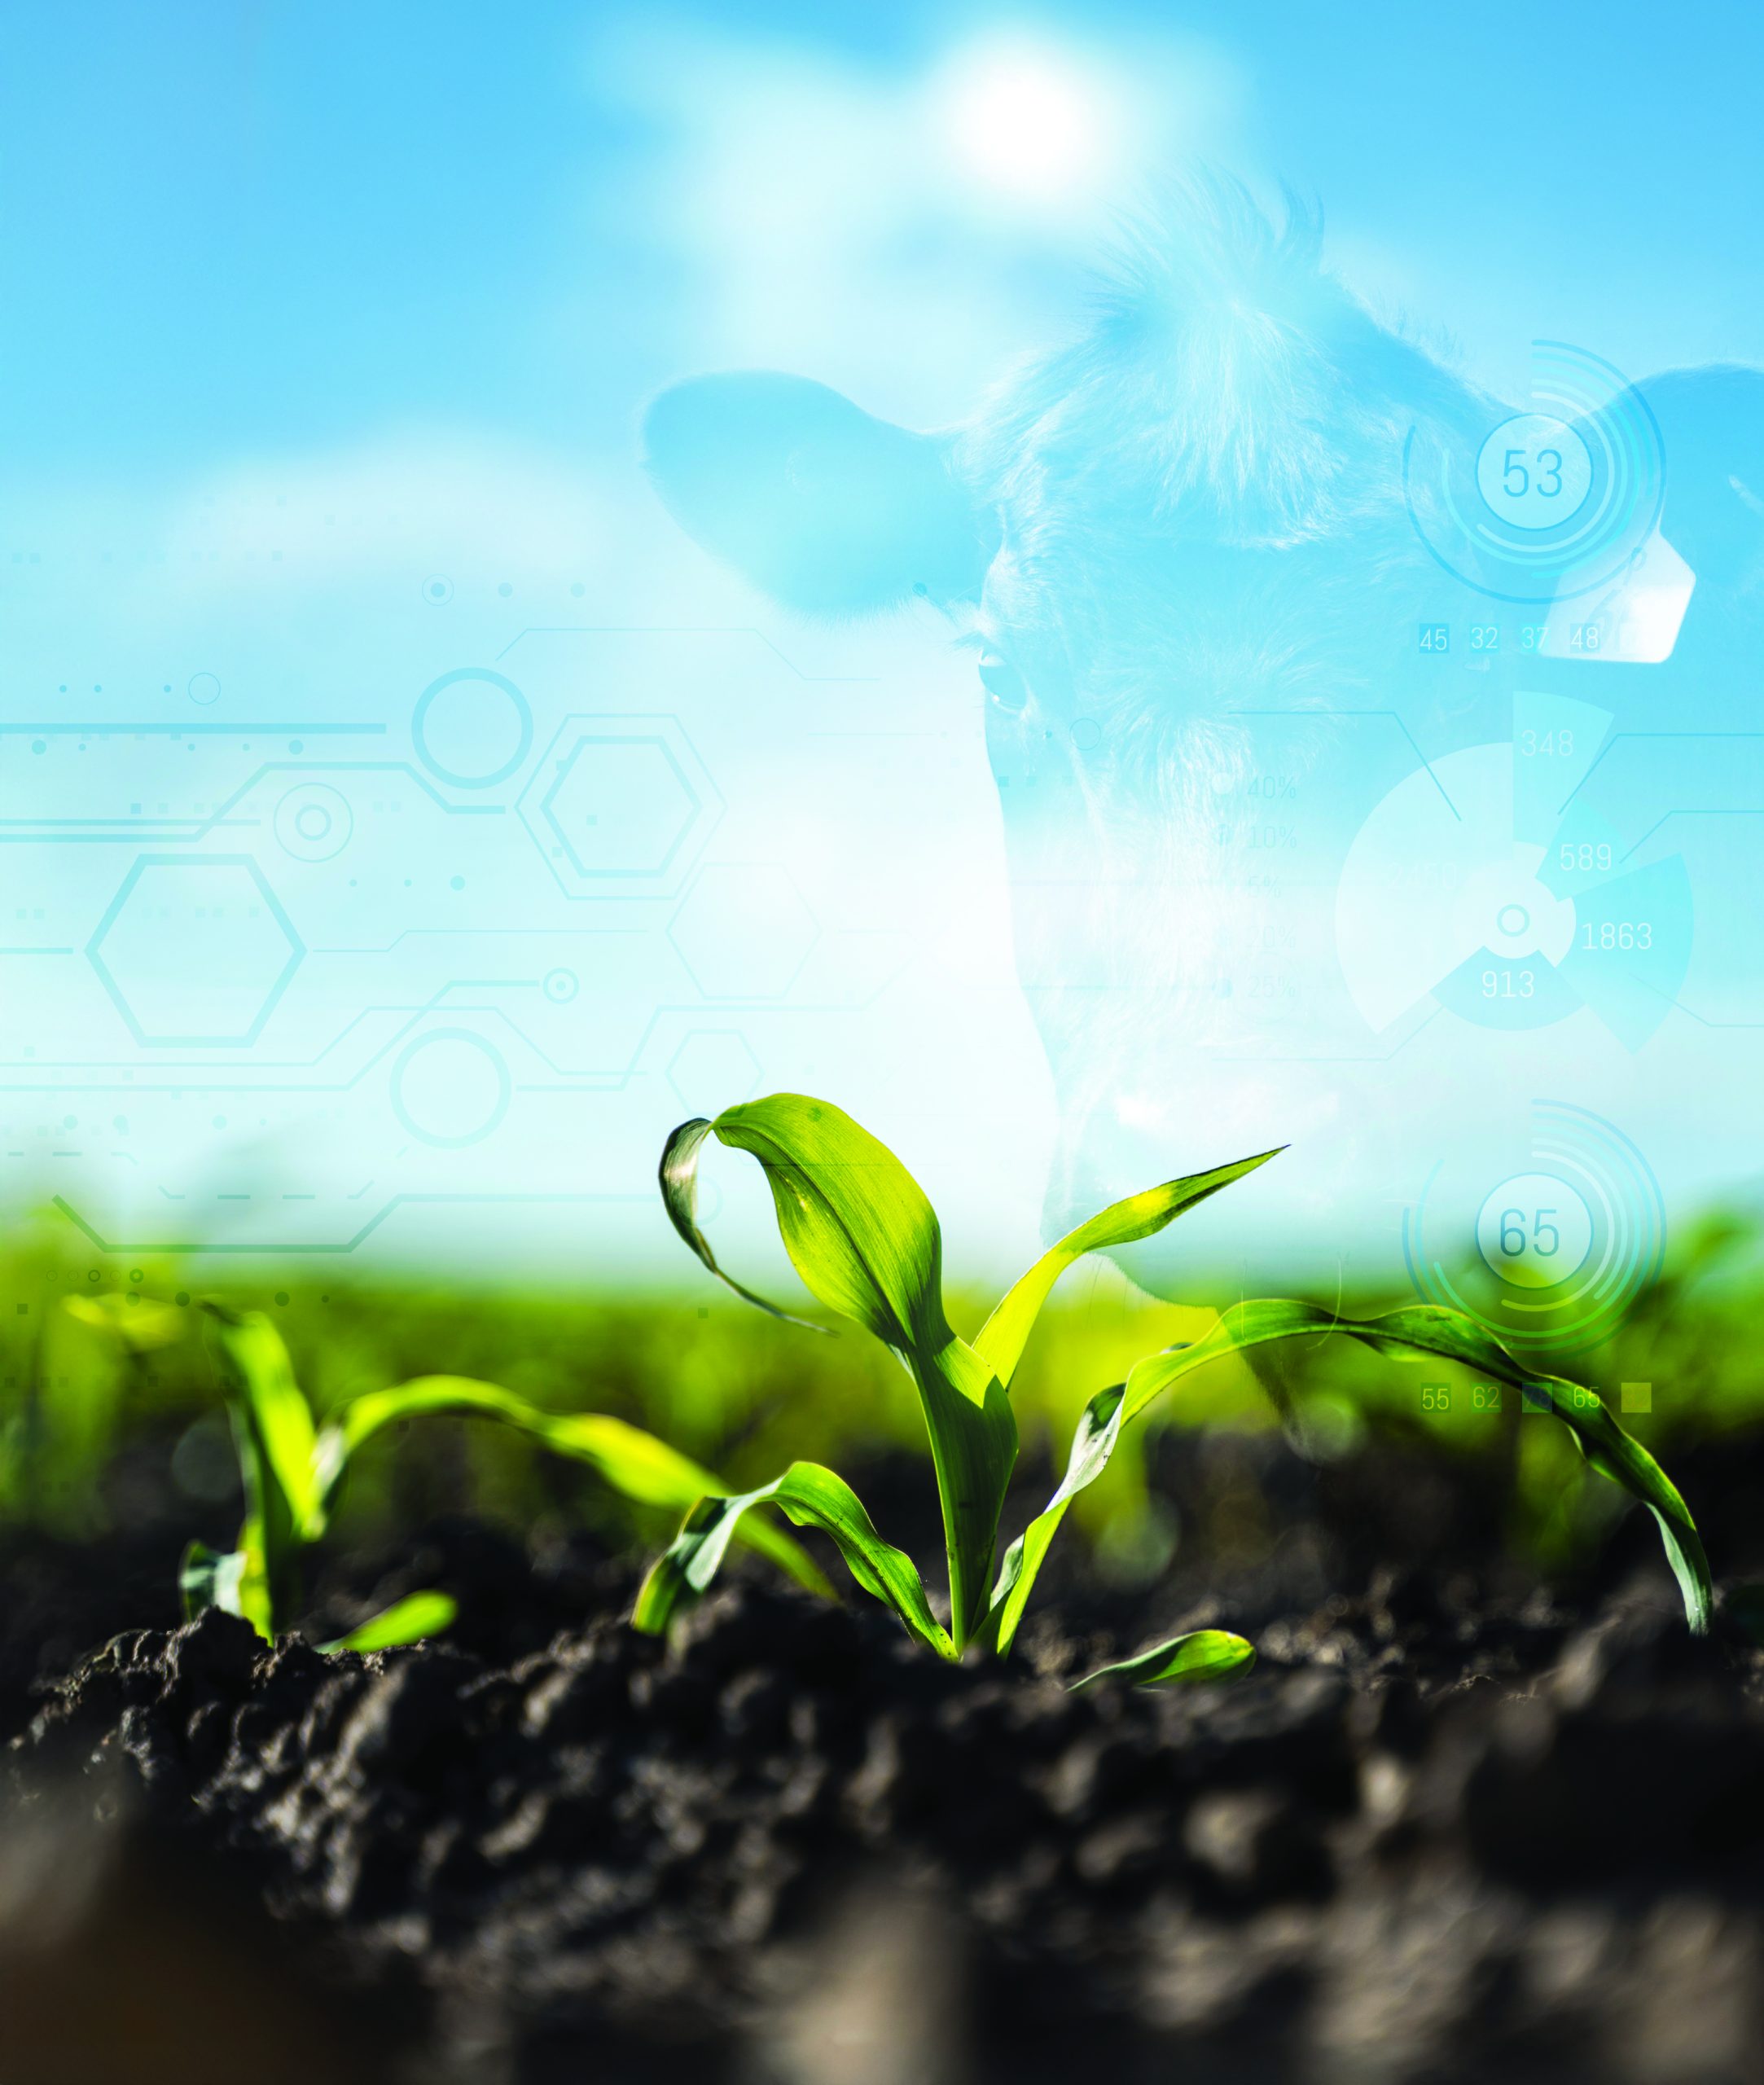
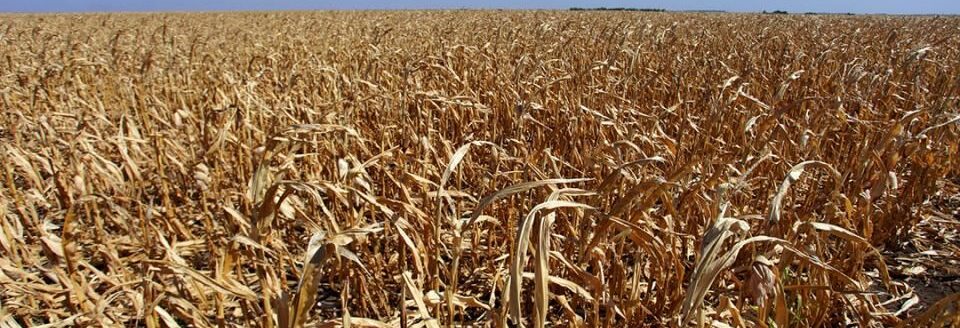
There is data everywhere you look and in places you do not see, feel, touch or know about. Data is the arithmetic that sums up the things we do every day. Data’s use makes or breaks deals. (Above, photos courtesy of Adobe Stock and artwork by Heather Noll.)
Farmers and ranchers are accustomed to being asked for data from several groups. Importantly, the combined data of those farmers and ranchers tell a story. Instead of being the suppliers of data, how are you farmers and ranchers using data in your story?
USDA a purveyor of agriculture data
When people in the agricultural community think of data, they think of the U.S. Department of Agriculture. Ask farmers or ranchers, and they know about USDA since they are the key contributors or suppliers of data compiled by USDA.
There are many agencies within USDA that compile, generate and disseminate data from all sectors of agriculture for the U.S. and from around the world. One of the most well-known and established agencies at USDA is the National Agricultural Statistics Service. Its tagline is “agriculture counts” by conducting “hundreds of surveys each year.” Its surveys are of farmers and ranchers, and others from the agricultural supply chain.
The surveys from NASS are compiled and transformed into reports, including crop and livestock production, crop progress, price information, chemical usage, farmer economics, etc. The data and resulting reports are released throughout the year on a published schedule that includes the date and time. The release depends on the report and time of year and could be weekly, monthly, quarterly, annual or quinquennial releases.
While NASS has its critics, its reports are the benchmark by which all prognosticators compare their estimates and forecasts. At the end of the day, or the crop marketing year, no one else delivers the number of reports across the variety of commodities and products that NASS does.
Over the years, people have told me that NASS has lost its relevance, that it skews the results, tries to move crop price in one direction or another, and so on and so forth. As a former NASS statistician, I can assure those critics that NASS has very talented people, who at the end of the day are bureaucrats in the best sense of the word—that is, they work as impartial agents to deliver the best results to the agency.
Because of the set schedule, the team at NASS works hard to deliver on time, as required by law. As they compile survey results, they are conducting the necessary quality checks to let the data do the talking and tell the story. In other words, they are assuring the public what farmers, ranchers and industry participants report, and not what market participants hope to hear.
NASS has a helpful document titled “Why Corn and Grain Producers Should Respond to National Agricultural Statistics Service Surveys” that is worth a read. An excerpt of that can be found in the side bar.
One criticism of NASS is that the number of interviews and response rates have been declining. From the recent Crop Report released in September, for example, NASS reported crop yield and production for corn, soybeans and cotton and other crops. As an example of the decline, the number of interviews for “probable” yield in that report totaled 6,900. Since 2010, the number of interviews for the September report nearly has been cut in half. While this is dramatic, according to Lance Honig, director of methodology division and chair, Agricultural Statistics Board at NASS, the level of accuracy has held despite the drop in responses.
Honing acknowledged the response rate has also dropped in recent years. It was about 70% for the September report, down from 80% in the past. Taking it from me, having a 70% response rate is commendable and good enough compared to many other government and industry surveys.
“While response rates have declined, they have leveled off. NASS has fared better than most other government agencies, and the response rates are still good levels,” Honig said.
NASS cites a number of reasons for the decline, but none is more important than the burden of the respondent. Honig emphasized that more questions on a survey lowers the response rate. From my time at NASS, it was engrained in the statisticians’ mind to minimize respondent burden without compromising results.
However, Honig is not letting good enough be good enough. The NASS team strives to improve the response rate with improvements in methodology and samples of people to interview. In many respects, a smaller sample size of a proper group will deliver remarkable results, but having greater participation brings greater confidence in the result, something that Honig highlighted.
My recommendation to you is to let agriculture count from your farm or ranch to tell the story!
Industry uses agricultural data, and farmers and ranchers need to be connoisseurs, too
The data released from across USDA is used by thousands of market observers, participants and speculators. Some farmers also use data to enhance their operations. In what ways should farmers and ranchers engage the data?
As Honig said, having one data point, such as the September corn production forecast, does not mean much unless you can compare it to history and context.
Those collaborating with farmers and across the agriculture supply chain work to keep data in context, presenting analysis of NASS data with information from other agencies and other sources to deliver a mosaic of what is taking place in the market. For farmers, some might feel overwhelmed as a price taker to dig into the data, but understanding and engaging data for your farm or ranch is vital to understanding your profit potential and managing your risk within the spectrum of the market at large.
As Scott Sartor, founder and chief executive officer of Croptell, says, “Whether you’re looking to efficiently renew and underwrite your farm customers, improve your bank’s understanding of agricultural lending risk or grow your farm loan portfolio, data utilization is the force multiplier.” (Emphasis added.) Croptell works with farmers and bankers to use data to understand opportunities and risks.
Sartor helps farmers embrace public data such as what NASS publishes “as a good resource to help find correlative values for their farms and operations.” He went on to say, “We are at a point where we need data fast and to run financial calculations at warp speed.” Without an adequate handling of the data, farmers and their bankers alike will not be able to endure “volatile movement in commodity prices that are essentially at the same level for decades while input costs have escalated,” Sartor said.
The key that Sartor sees for farmers is “getting a return from the data through ‘the financial last mile.’”
In his experience with farmers, Sartor sees few who have a functioning budget, let alone a “live” or updated financial footprint.
Farmers can leverage data to better understand their financial needs and communicate them to their lender, crop insurers and crop marketing advisers. In addition to the publicly available data, Croptell has identified key farm level indicators not used in lending.
Sartor believes machine learning on farm data is still in its infancy, but as it matures, it will pay dividends for farmers through more precise financing and risk management. Croptell builds predictive models to fill gaps between farmers — who are not accountants or chief financial officers — and their bankers and financial institutions. As an example, they might take agronomic data from a farm operation and build a financial plan that is more appropriate for the farm, based on soil type.
In essence, they are using a farm level assessment and communicating that financially.
Embrace data or become a statistic
Data is powerful and, if used properly, it is meaningfully profitable. The amount of data created and consumed is growing exponentially. It is daunting to consider how much data is generated. According to a 2020 Forbes article, in “2010 the world created about two zettabytes (ZB) of digital information. If that were put into 1 GB thumb drives that were then laid end to end, it would make a line that could stretch across 184 million football fields. That sounds impressive, until you consider that the World Economic Forum figures there will be 44 ZB collected in 2020.”
Data comes in all kinds of forms and formats, and keeping up with it can be overwhelming, but help is on the way. No, it is not a bureaucrat who says, “I am with the government, and I am here to help you,” and, no, it is not science fiction or voodoo science.
Susan Olson, Ph.D., founder, Action Intel, says there are many tools to aggregate, compile and act on data. Olson said, “The powerful predictive tools that enhance decision-making in ways traditional statistical models cannot include artificial intelligence and machine learning. While these technologies have been in use for decades, their recent accessibility, thanks to advancements in cloud computing, has brought generative models like Claude and ChatGPT to the hands of anyone with a smartphone.”
Accessibility to data has opened doors for incorporating neural networks into various stages of the grain and animal value chain, as Olson emphasized, primarily by increasing profit margins through informed decision-making, which Sartor pointed out as well.
One example of open doors is if you have five government reports in Acrobat or PDF format, and you want to understand their insights on corn basis at a regional elevator or lot, AI can quickly analyze these documents, Olson said. What might take hours of reading can now be accomplished in minutes. This is not lost on Honig, who said NASS is using the same approach to compile survey results.
Olson stresses that “AI results are not perfect, and results should always be cross-checked, but the tool can boil down a large amount of disparate information into a series of coherent points.”
For a richer value proposition, Olson gave an example. Consider a scenario where a farming operation aims to process vast datasets, like multiple years of data from 50,000 acres, to optimize crop management decisions. This data may include information on input applications, soil amendments, harvest and financial returns, among others. To harness this amount of data effectively, according to Olson, “Expertise from a trusted partner is essential.”
Olson went on to say, “We’re not at the point yet where you can just dump Gigabytes of unprocessed data into a web application and expect useful insights. This is where experts come in to help with data extraction, data transformation, model choice and quality assurance of results.”
With data you have two options, embrace it to tell a story to lead to productive results, or become a statistic.
What will be your story with your data, data, data?
Ken Eriksen can be reached at [email protected].
Why producers should respond to NASS Surveys
- Farmers, ranchers, policymakers, community planners, agribusinesses, researchers, USDA and other federal and state government agencies use aggregated NASS data from farmers and ranchers for planning, market assessment, decision making, research and many other purposes.
- High-quality statistical information is essential for the smooth operation of federal farm programs as well as for planning and administering federal and state programs in areas such as consumer protection, conservation and environmental quality, trade, education and recreation.
NASS information contributes to a stable economic climate and reduces the uncertainties and risks in producing, marketing, and distributing commodities. Objective, timely and equally available to all users, NASS data help level the playing field.


