Despite record crops anticipated grain storage utilization to handle it in stride
In its August “Crop Report,” the National Agricultural Statistics Service at the U.S. Department of Agriculture reported a large boost to corn production for the 2025-26 crop year.
NASS increased corn harvested area by 1.9 million acres to 88.7 million while raising corn yield by a whopping 7.8 bushels per acre to 188.8 bushels. Taking harvested area times yield, corn production is forecast to be record large at more than 16.7 billion bushels.
Despite NASS posting a record soybean yield of 53.6 bushels per acre, production is expected to be 74.3 million bushels lower on a reduction in harvested area. Based on surveys and field observations, NASS reduced harvested area 1.6 million acres from the July forecast to 80.1 million for August, nearly 6 million acres less than last year’s harvested area.
Sorghum production for 2025-26 is forecast to total 396 million bushels, an increase of 53 million bushels from the previous year and partially offsetting the drop in soybean production.
Because of the large corn outlook, row crop production this fall is forecast to total a record 21.4 billion bushels. This will be an increase of 1.9 billion bushels, nearly 10% higher than last year.
Despite a large crop potential, there is still time before harvest begins and the final yield remains an unknown. The crop can be greatly impacted by changes in weather between now and harvest. Regardless, and suffice it to say, such a large production potential in August raises grain storage concerns once harvest gets underway.
Grain storage utilization tightening
With a large forthcoming harvest, grain storage is a concern. Across the United States there was 25.5 billion bushels of grain storage capacity on Dec. 1, 2024, as reported by NASS. Grain storage capacity expansion has slowed in recent years due to higher installation and material costs, smaller supplies and lower crop prices. For Dec. 1, 2025, capacity will essentially be unchanged, perhaps slightly higher than 2024.
Over the past five years grain storage capacity increased 325 million bushels, about 65 million annually or 0.3% per year. Most of the rapid expansion in grain storage took place between 2005 and 2015 following the enactment of the Renewable Fuels Standard in 2005.
Most grain storage is located on farms, averaging 53.5% of total capacity over the past five years. On-farm storage is a tool to manage harvest pace while an opportunity to manage price risk. The reality of on-farm storage is that it is essentially used once to hold grain until moved into the value supply chain.
Off-farm storage has been increasing at a faster rate than on-farm storage, more than 3% annually in the past five years while on-farm storage has increased less than 1%. Unlike on-farm storage, off-farm storage is used or turned multiple times during the year as grain is moved downstream through the value supply chain. Grain is a storable commodity, meaning it is harvested and then stored for future use. Livestock or crude oil, on the other hand, are flowable commodities that are constantly being harvested or produced and sent through their respective value supply chains.
A part of future use of grain is ending stocks of a marketing year and they become beginning stocks for the next marketing year. Sept. 1, 2025, grain stocks for example, reflect the remaining supplies of barley, oats and wheat harvest and ending stocks of corn, sorghum and soybeans from the previous marketing year.
Sept. 1 grain stocks for 2025 are forecast to total nearly 3.9 billion bushels, 451 million or 10.4% below levels one year ago. Over the previous five years, Sept. 1 grain stocks have averaged 4 billion bushels.
Adding the record 2025 fall harvest to Sept. 1 grain stocks will lead to a record supply of grain this fall. Total grain supplies for 2025 during September through November are forecast to total 25.3 billion bushels, 1.4 billion or 6% more than the prior year.
With grain storage capacity expected to be relatively unchanged, capacity will tighten, exceeding 99% utilization. Capacity utilization was last this high in 2017 while exceeding 101% in 2016. Over the previous five years grain storage utilization across the U.S. averaged 91.6%.
Storage utilization levels are monitored closely by grain merchandisers and handlers, and transport providers. Merchandisers and handlers want to know what they have coming at them and how they need to manage storage capacity and implement risk management programs. Transport providers look at utilization levels to gauge pressure in grain deliveries and the locations where storage is more utilized and the timing when grain needs to be moved.
Grain supplies (Sept. 1 grain stocks plus fall production) and grain storage capacity are shown in Figure 1. Tight or highly utilized capacity is observed in 2007, 2009, 2016 through 2018, and now in 2025.

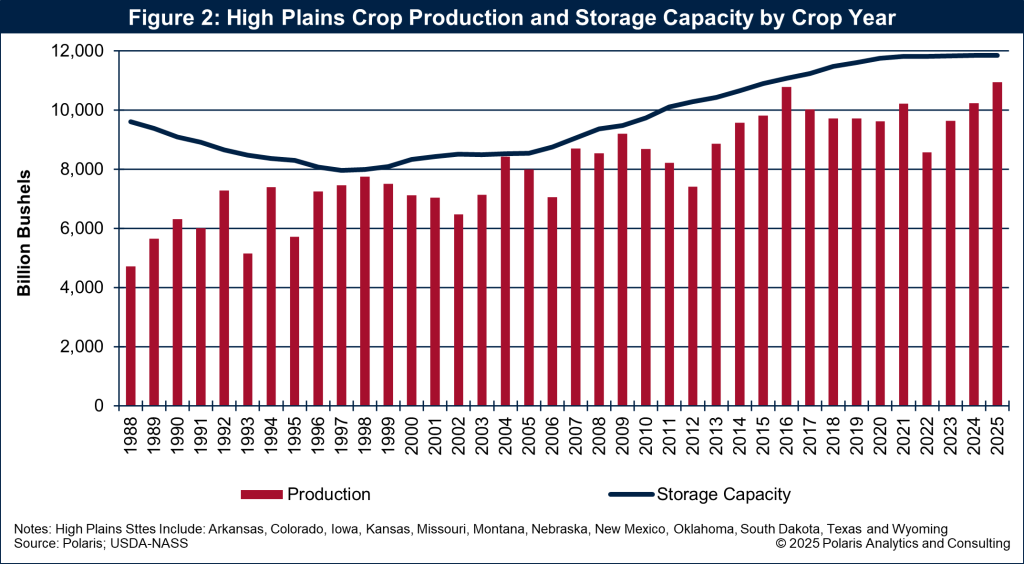
High Plains crop production surging to record levels while storage capacity appears adequate
Production of all crops across the High Plains is expected to be large for the 2025-26 marketing years, increasing 713 million bushels or 7% to 10.9 billion bushels. This will be the second consecutive year that production exceeds 10 billion bushels, and the fifth time in history for the High Plains. The surge in corn production is due to favorable growing conditions.
Grain storage capacity across the High Plains has plateaued at 11.8 billion bushels since 2020. Despite crop production forecast to be record large across the High Plains, storage capacity will be more than adequate as shown in Figure 2. However, there will be states or pockets where capacity will be highly utilized.
Grain storage utilization is important, but rate of demand more so
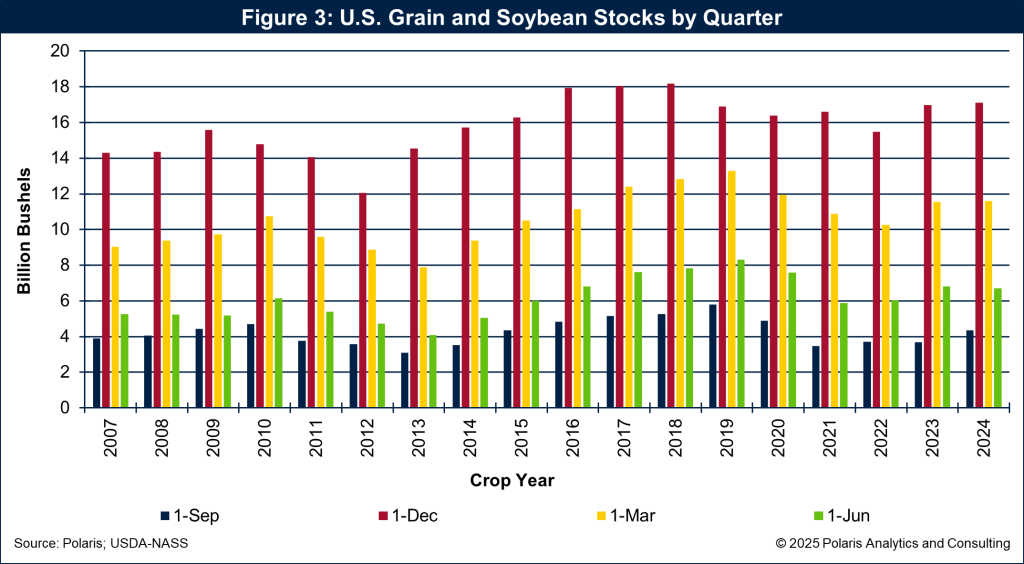
Grain storage utilization is an important metric to gauge how tight capacity is or will be. However, that is only one part of the equation. Understanding the rate of demand or the movement of grain through the value supply chain is important.
Grain stocks are highest on Dec. 1 following the harvest of corn, sorghum and soybeans. From Dec. 1, nearly one-third of the grain in storage moves into the value supply chain and is consumed either domestically or in the export markets by March 1.
The greatest variable impacting grain flows out of storge during the December through February crop quarter is the U.S. grain and soybean export pace. During the U.S.-China trade war in 2018 into 2020, the amount of grain moved out of storage dropped to 21%. With a strong U.S. export program this year, especially with a record forecast for corn exports, grain will not be in storage for an extended period as it needs to be moved at a fast pace to export position.
The rate of grain consumption or demand is illustrated in Figure 3 that reflects the change in grain stocks from one crop quarter to the next.
While grain storage utilization will be tight, especially across various regions and pockets of the High Plains and the U.S., it will be tight for a short window. The rate of consumption or demand will minimize the need to rapidly expand storage capacity.
Ken Eriksen can be reached at [email protected].