Digital tools give producers a closer look at effects of drought
The United States Drought Monitor defines drought as “a moisture deficit bad enough to have social, environmental or economic effects.” Agricultural producers know very well how devastating the effects of drought can be. Recognizing when drought is emerging—or ending—requires knowing what normal local and seasonal conditions are and analyzing them over time. Several government agencies collaborate to provide producers and other stakeholders with that valuable information.
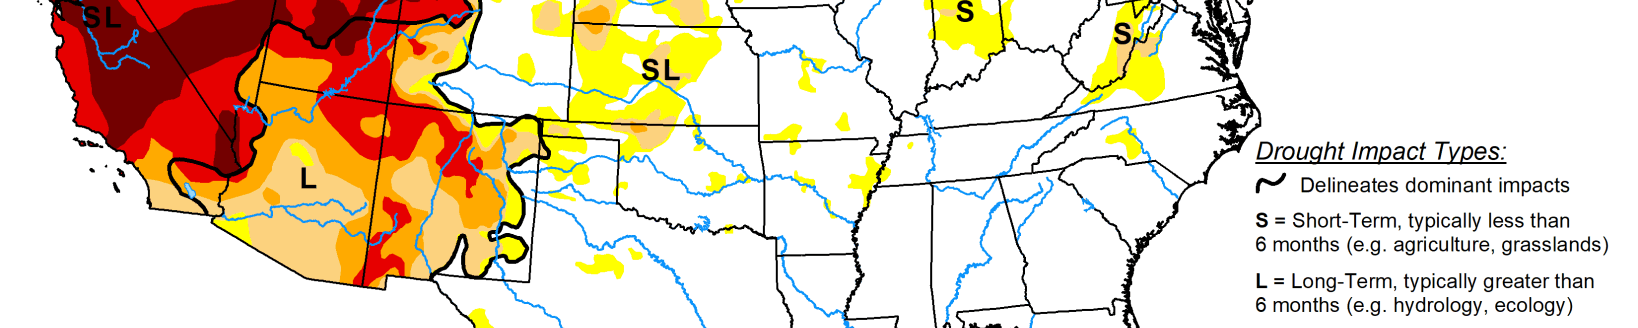
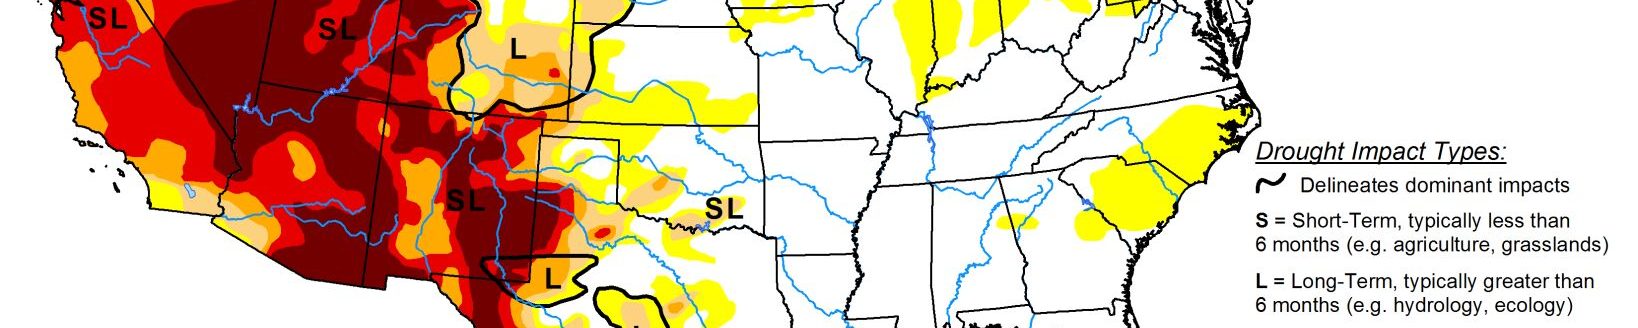
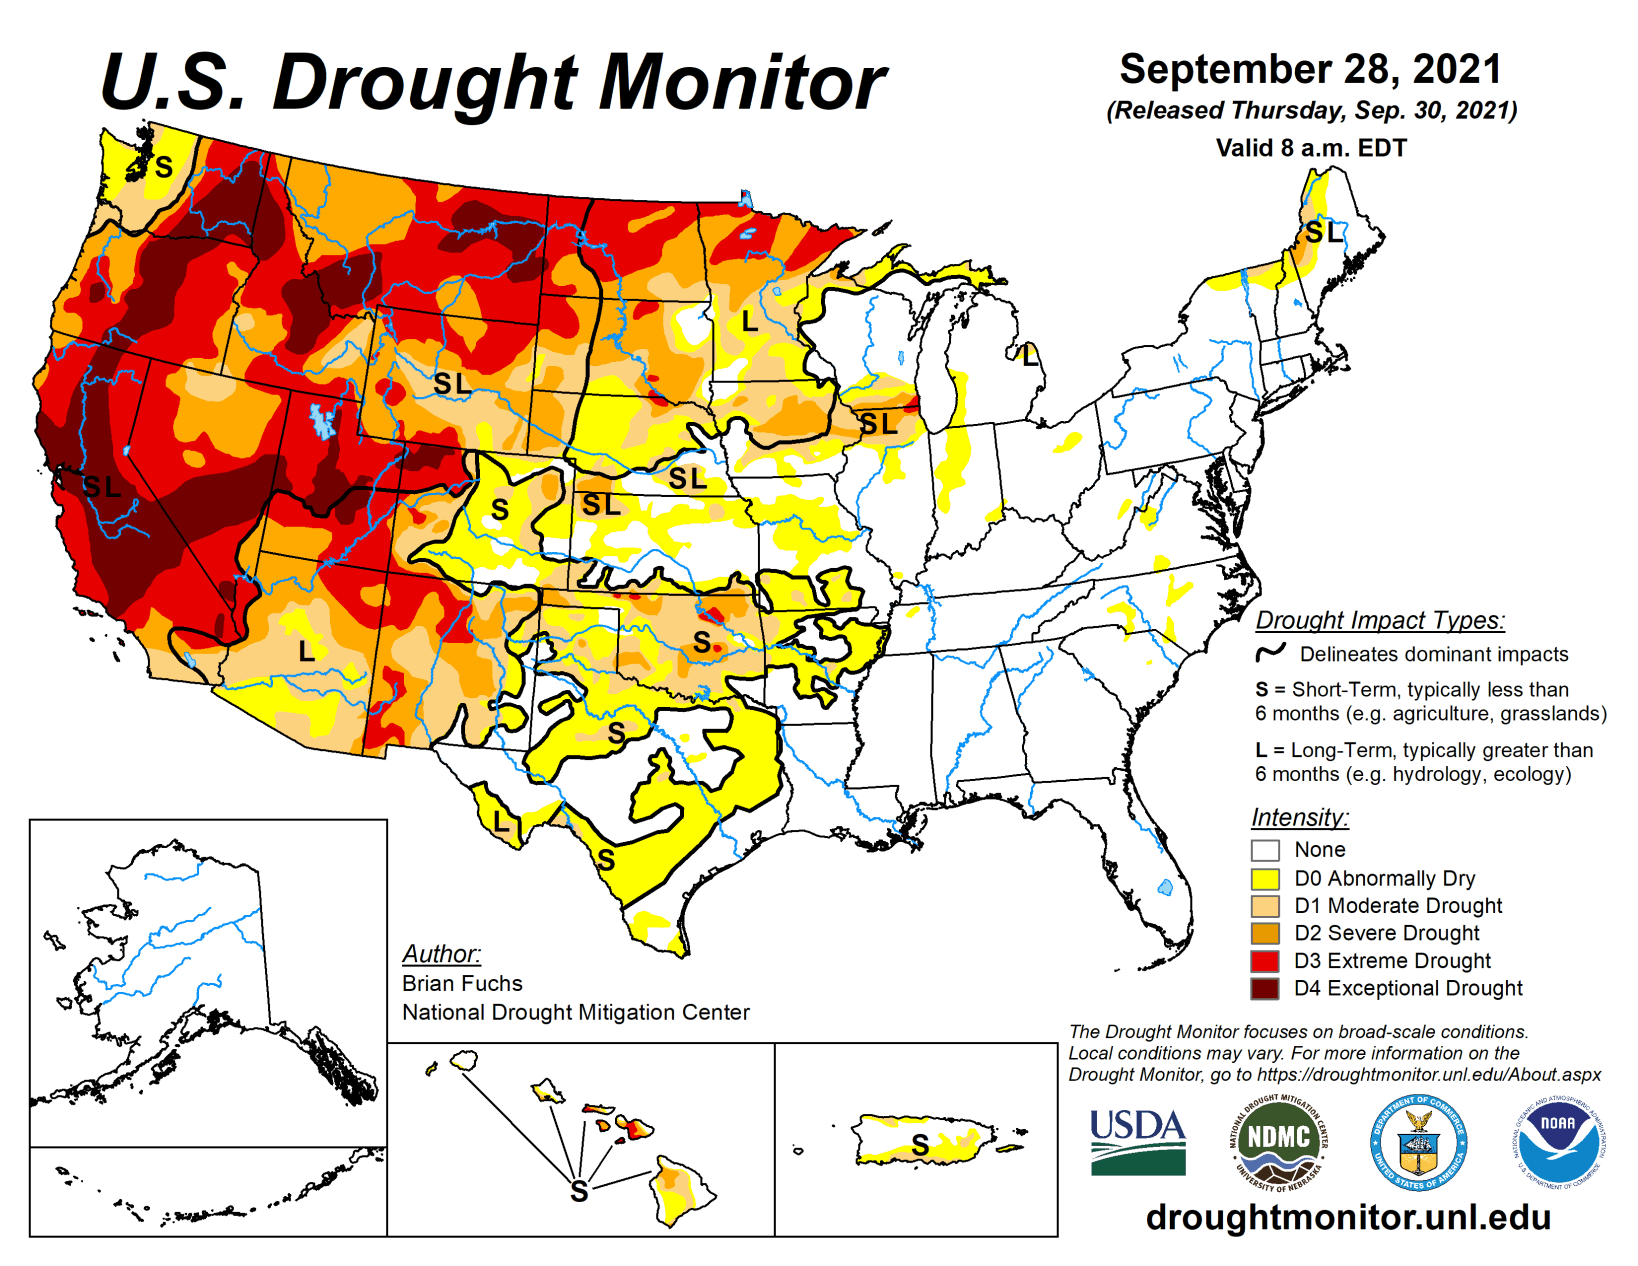
The U.S. Drought Monitor map, released every Thursday at droughtmonitor.unl.edu, shows current drought conditions in the U.S., including Puerto Rico, U.S.-Affiliated affiliated Pacific Islands and U.S. Virgin Islands. Since 1999, the Drought Monitor has been a team effort of the National Drought Mitigation Center at the University of Nebraska-Lincoln, the National Oceanic and Atmospheric Administration and the U.S. Department of Agriculture. Members of all three organizations take turns creating the maps.
The weekly map uses five classifications to report drought conditions:
1. Abnormally dry (D0), showing areas that may be going into or are coming out of drought;
2. Moderate drought (D1);
3. Severe drought (D2);
4. Extreme drought (D3); and
5. Exceptional (D4).
“The USDA uses the drought monitor to trigger disaster declarations and eligibility for low-interest loans. The Farm Service Agency uses it to help determine eligibility for their Livestock Forage Program, and the Internal Revenue Service uses it for tax deferral on forced livestock sales due to drought. State, local, tribal and basin-level decision makers use it to trigger drought responses, ideally along with other more local indicators of drought,” according to the Drought Monitor.
Many types of data are used to compile the weekly map, including the Palmer Drought Severity Index, the Standardized Precipitation Index and other climatological inputs; the Keech-Byram Drought Index for fire, satellite-based assessments of vegetation health, and various indicators of soil moisture; and hydrologic data such as the Surface Water Supply Index and snowpack. More than 450 observers across the country, including hydrologists, climatologists and National Weather Service staff, also provide reports.
The Drought Monitor website offers the ability to compare maps and see animations of changes over a set time period. Although the weekly Drought Monitor maps look backward at data, the site also offers Monthly Drought Outlook maps and other products that predict the likelihood of drought developing, persisting, improving or ending.
Drought.gov
A related resource, www.drought.gov, gives a closer look at drought-related information. Kelsey Satalino, with the National Oceanic and Atmospheric Administration’s National Integrated Drought Information System, introduced the recently redesigned Drought.gov site during a Western Drought Webinar this past summer.
“The site is a one-stop shop for interactive maps, data and drought decision support information, showcasing the work of our partners all in one place,” she said.
“Users can enter their city, ZIP code or county and click to view a location page that shows up-to-date drought information for that specific location.”
Visitors can find current conditions, drought trends, maps showing the impacts of drought on agriculture, water supply conditions, public health effects, drought outlooks and forecasts, and historical drought information down to the county level.
Interactive data and maps can be searched by topic and compared. Graphs and maps enable users to see that information, side by side, with data going back to 1895.
Users can select a data set and a time period, then view information at the state or county level, Satalino said.
Drought.gov is an interagency resource with a broad range of partners, with many other links and resources related to drought and research. More customization is in progress for drought decision-makers across the U.S.
Drought Impacts Toolkit
UNL’s National Drought Mitigation Center also offers a Drought Impacts Toolkit at https://droughtimpacts.unl.edu.
Citizen scientists may submit Condition Monitoring Observer Reports using a dry-to-wet scale to capture what they see at a specific place and time.
The toolkit site also includes links to news stories reporting on drought and maintains an archive. The Visual Drought Atlas allows users to compare the appearance of landscapes over time in dry, normal and wet years.
U.S. Agricultural Commodities in Drought
USDA’s Office of the Chief Economist uses the Drought Monitor to compile a weekly U.S. Agricultural Commodities in Drought map at https://agindrought.unl.edu. The site shows tables, charts, maps and animations of how drought is affecting crop and livestock regions.
Shauna Rumbaugh can be reached at 620-227-1805 or [email protected].