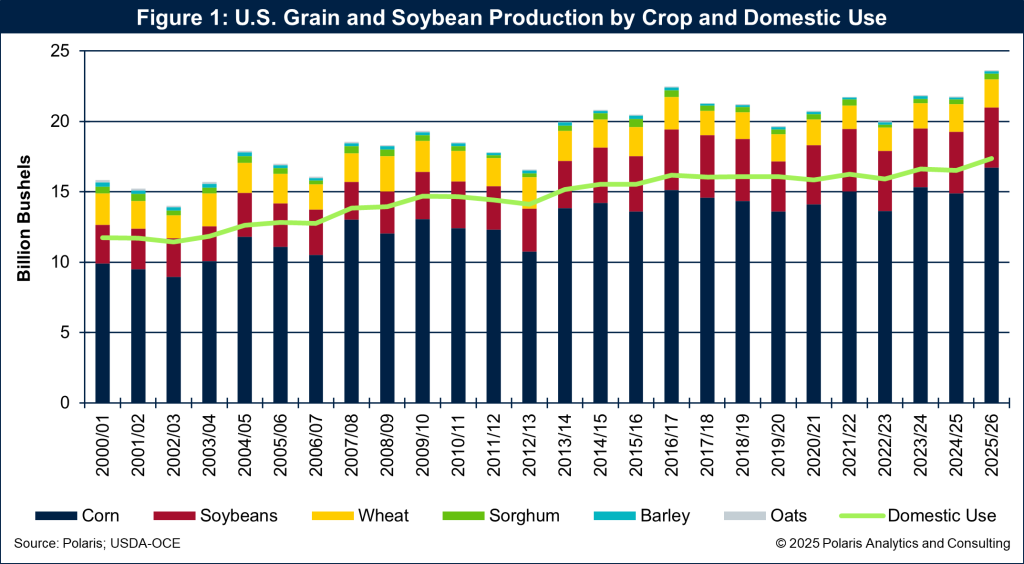
Farmers in the High Plains and across the United States harvested a record crop for the 2025–26 marketing year, topping 23.6 billion bushels—up 8% from last year.
Corn led the surge at 16.7 billion bushels, 12% higher than 2024–25. Soybeans slipped 3% to 4.3 billion bushels, while wheat held steady near 2 billion bushels. Final production figures will be confirmed Jan. 12 in the U.S. Department of Agriculture’s Crop Production Annual Summary.
Plentiful supplies will easily meet domestic needs and leave ample surplus for export. U.S. consumption, feed, food, seed, and industrial use, is projected at a record 17.4 billion bushels, up 5%. Corn and soybean demand dominate, driven by biofuels and livestock feed.
U.S. grain and soybean production by crop and total domestic use are shown in Figure 1.
Global output outpaces demand
World crop production is forecast at 2.77 billion metric tons in 2025, up 3% from last year, fueled by record U.S. corn and large Brazilian crops.
Over the past five years, global output grew 1.7% annually, while consumption rose 2.2%. Demand remains steady despite population declines in key markets, supported by rising incomes and calorie intake.
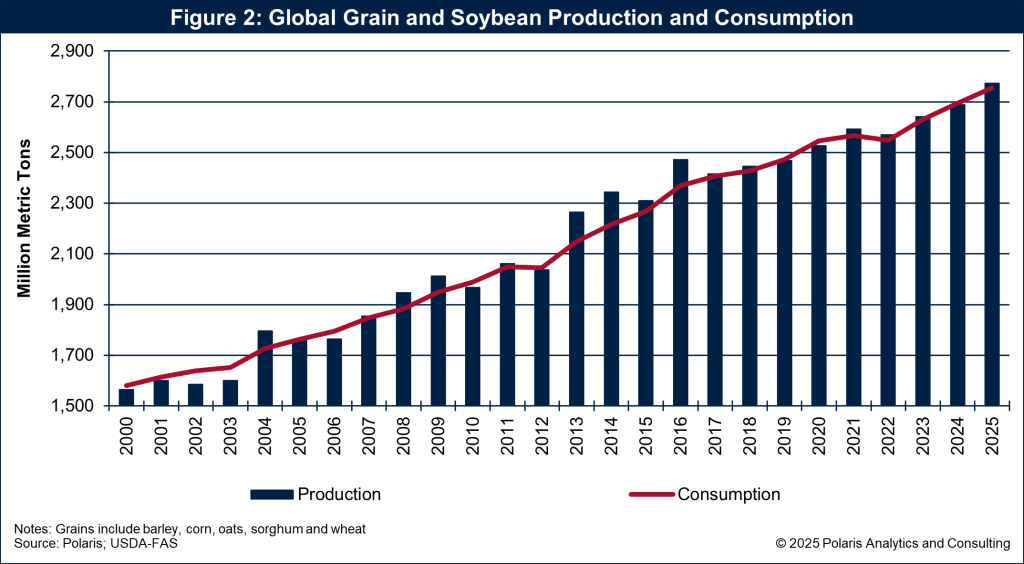
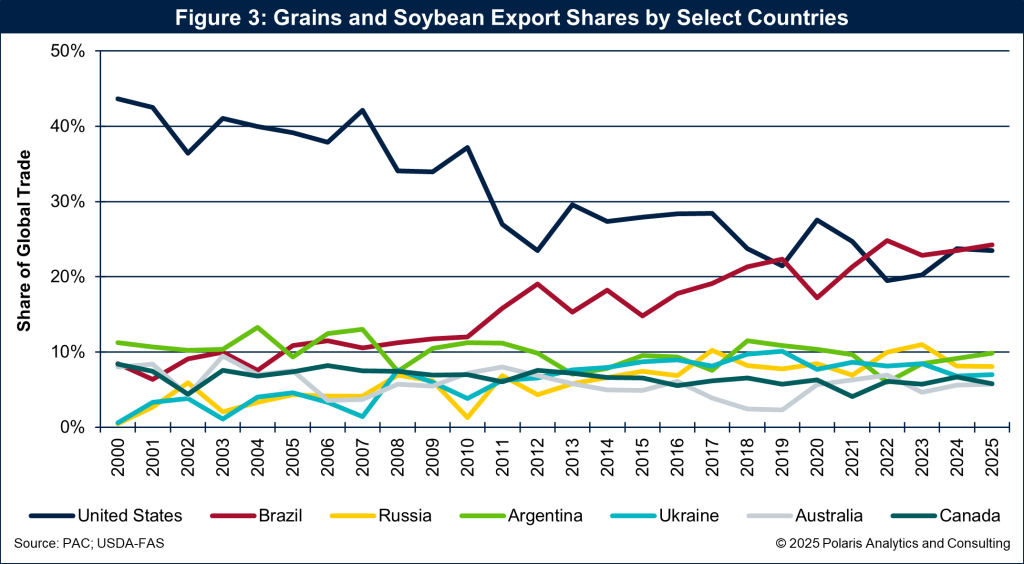
Since 2000, production has exceeded consumption in 14 years, including 2025. That surplus keeps pressure on prices as shown in Figure 2. Meanwhile, U.S. dominance in global trade has faded: From over 40% share in the early 2000s to about 25% today, matched by Brazil’s rise as shown in Figure 3.
Domestic demand anchored by biofuels
While export share shrinks, the U.S. domestic market remains strong.
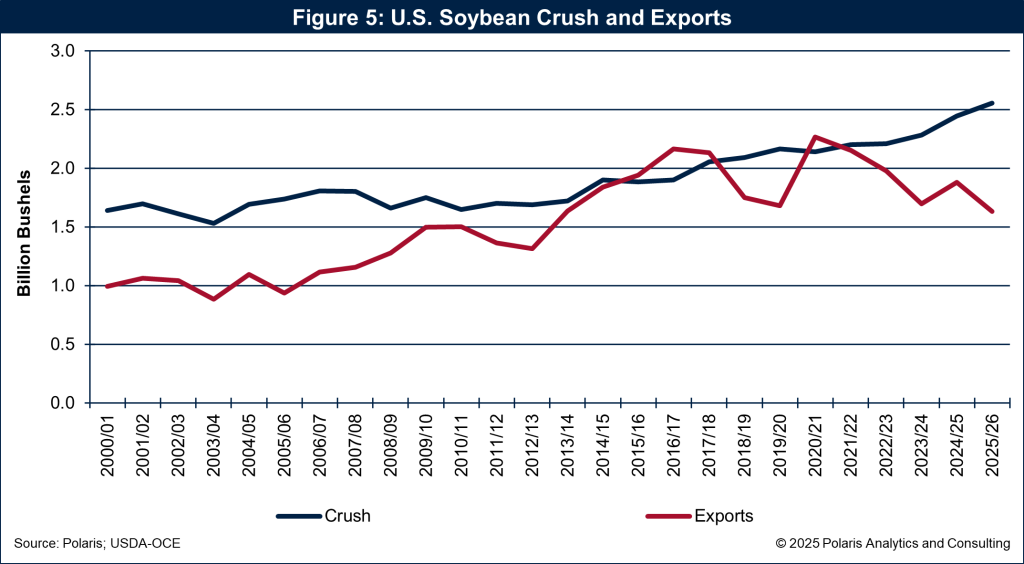
Ethanol demand for corn and renewable diesel from soybean oil continues to expand. Higher soybean crush rates mean more soybean meal flowing to livestock and export channels. This structural shift supports crush margins, but tightens soybean supplies for trade.
Corn usage is shown in Figure 4 and soybean crush and exports in Figure 4.

Exports stay strong despite competition
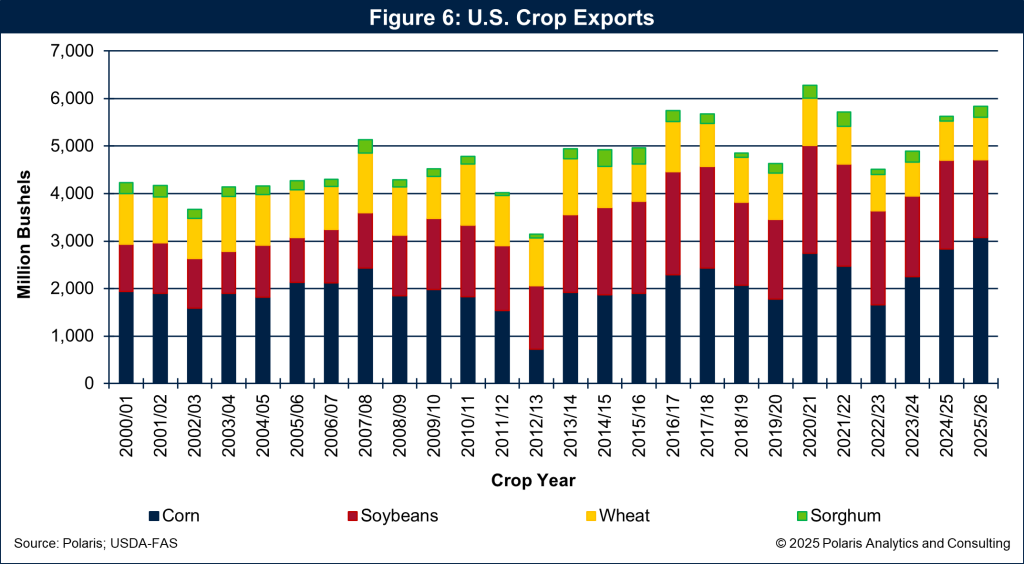
Even with reduced global share, U.S. export volumes remain robust. Shipments have hovered around 5 billion bushels annually since 2016–17, hitting 6.3 billion in 2020–21.
For 2025–26, exports are projected at nearly 6 billion bushels, which would be second highest on record.
Corn leads at 3.2 billion bushels. Soybean exports face headwinds from domestic crush and trade friction with China. If China fulfills its pledge to buy 12 million metric tons in 2025 and 25 million annually through 2028, tight U.S. stocks could force rationing or shift demand to South America. U.S. exports by crop are shown in Figure 6.
Prices slide, margins tighten
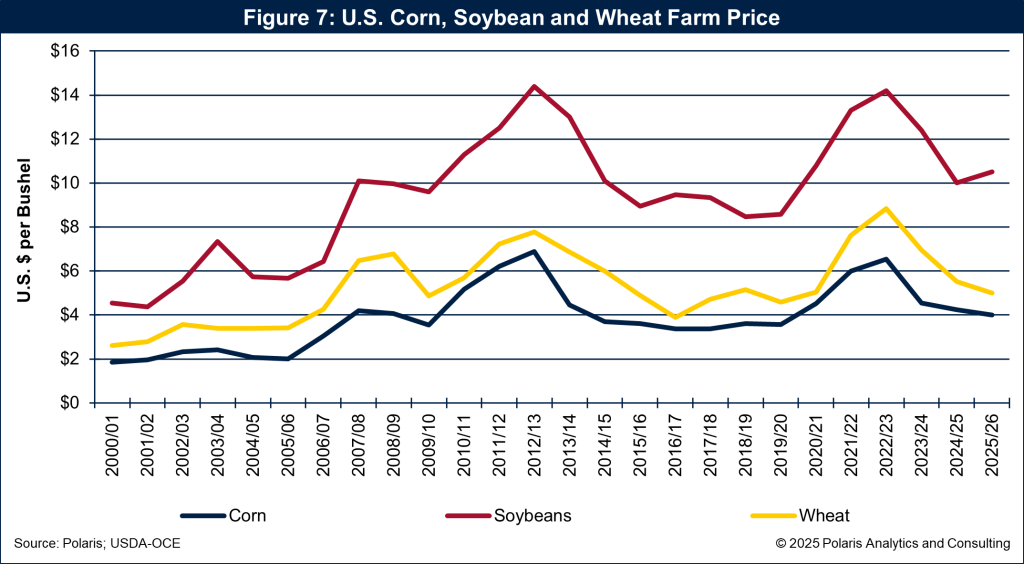
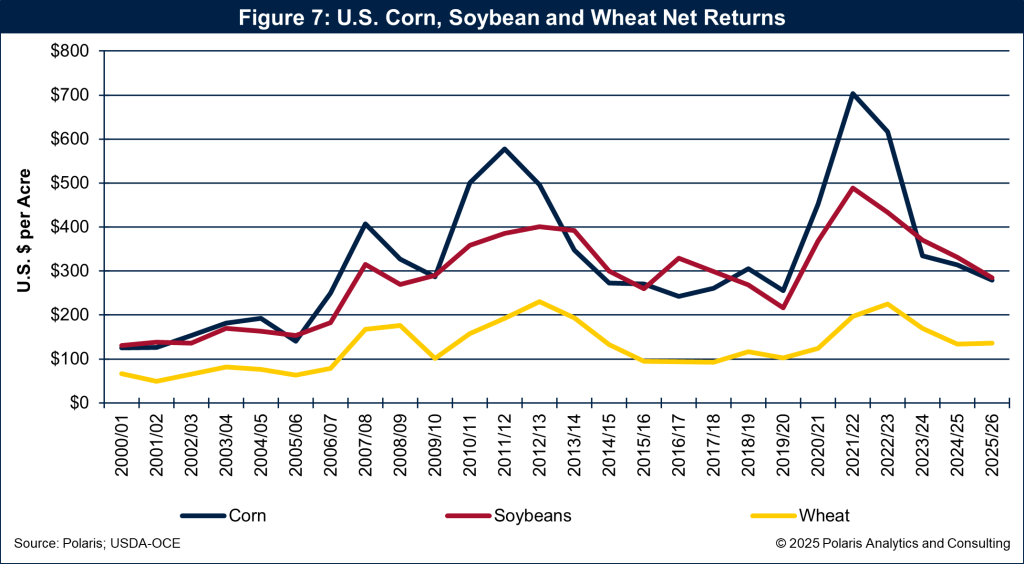
Corn and wheat prices continue to soften, while soybeans edge higher as shown in Figure 7. Net farm returns are expected to decline for corn and soybeans, with wheat stabilizing as shown in Figure 8. Rising input costs, fertilizer alone accounts for roughly 35% of operating expenses for corn, compound the challenge.
A $12 billion federal bridge package offers limited relief against global competition and tariff uncertainty.
Looking ahead
Farmers face tough decisions as they plan spring planting and year-end tax strategies. Lower prices and higher costs demand careful risk management. Will acreage shift toward soybeans to capture crush demand? Or will growers lean on crop insurance and marketing tools to protect margins?
One certainty: resilience remains the High Plains hallmark.
Ken Eriksen can be reached at [email protected].