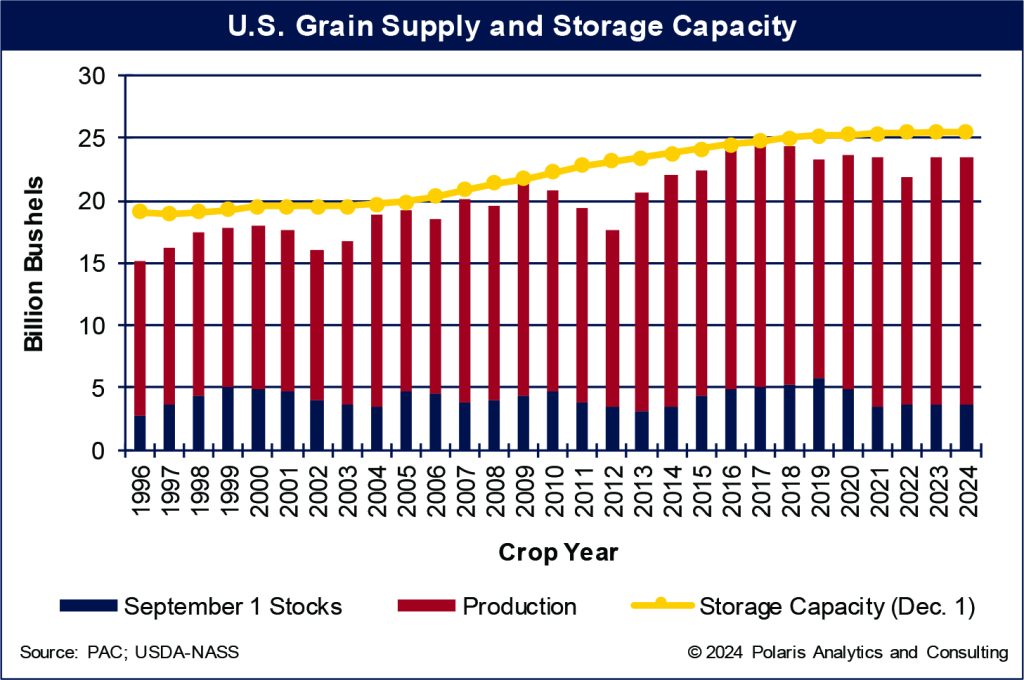
While harvest is months away, it will need a place to go, either directly to a position of consumption or into a storage location. On Dec. 1 last year, grain crop storage in the United States totaled a record 25,468 million bushels. Over the past decade, storage capacity has expanded by about 1% per year.
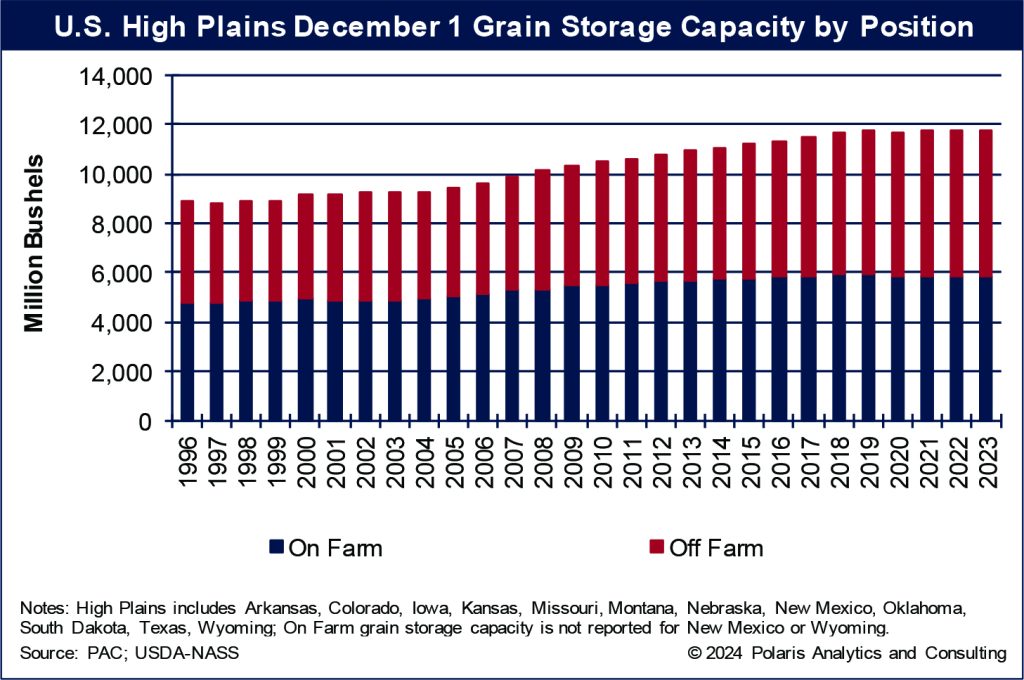
By location, on-farm storage represented 53% of all capacity. However, off-farm storage has been gaining ground with on-farm storage, increasing from a market share of 43% in 2000 to 45% in 2016 and 47% last year. Grain storage capacity by location is shown in the accompanying chart.
Constructing and erecting grain storage facilities has become more costly with persistent inflation and supply chain disruptions in the past few years. The main construction costs include stainless steel (up 46% from 2019 to a purchase price index of 140.0) and concrete (up 43% from 2019 to a purchase price index of 247.8), let alone labor and finance charges.
During September through December 2023, grain storage utilization tightened to 92% from 85% in 2022 as crop supplies (Sept. 1 grain stocks plus corn, sorghum and soybean production) grew 8% or 1,700 million bushels to 23,513 million while capacity expanded by 65 million bushels.
A storage utilization rate of 92% is not extremely tight, especially given that one-third of the grain that is in storage on Dec. 1 will be moved into the supply chain by March 1 of the following calendar year. That volume moved out of storage and consumed is equivalent to about 5,200 million bushels. Storage becomes an issue when utilization rates are higher than 97% and increasing, if there is a carry in the market that slows the movement of grain into the supply chain and if grain is not fully removed from storage before the next harvest.
If this year’s Sept. 1 grain inventories mirror last year’s, and adding USDA’s fall production forecast to that, crop supply during September through November will total 23,386 million bushels, or 126 million less than supplies during 2023. And if grain storage capacity is unchanged, storage utilization will relax below 91%, softening the pressure on the grain storage market. Crop supply and storage capacity are shown in the following chart.

High Plains, high capacity
Across the High Plains region, crop storage capacity totaled 11,754 million bushels on Dec. 1, 2023, representing about 46% of all capacity in the United States. On-farm capacity across the region totaled 5,875 million bushels (excluding on-farm totals for New Mexico and Wyoming due to data restriction rules) while off-farm capacity totaled 5,879 million, not much difference. However, off-farm capacity has grown at an annual pace of 1.2% in the past decade, while on-farm capacity grew 0.3% annually.
On-farm capacity did shrink during the derecho year of 2020, when a net 60 million bushels of capacity was wiped out by the high winds. On-farm capacity peaked at 5,910 million in 2018 and 2019. Grain storage capacity across the High Plains is shown in the following chart.

If crop production and supplies across the High Plains are like the United States, capacity utilization across the region will be relaxed and not as constraining. But, if crops turn out better than expected, and storage stays flat, capacity utilization rates could be a clarion call for expansion.
Ken Eriksen can be reached at [email protected].


