Cattle cycle bottoms to historic low. Will peak be historic low?
The cattle herd is progressively shrinking, and as of Jan. 1, it totaled 87.2 million head. This year’s inventory is the fewest since 1951, when the herd totaled 82.1 million.
Each subsequent peak in cattle inventory is lower than the previous peak, while each trough (or low point) is deeper than its predecessor.

Since 1950 there have been seven peaks (1955, 1965, 1975, 1982, 1996, 2007 and 2019) and six troughs (1958, 1967, 1979, 1990, 2004 and 2014, not including the current trough run). The number of years between peaks and troughs has averaged 5.3 years. The time moving from peak to trough is taking longer when it was two to four years from 1950 through 1979, and since then it has taken seven to eight years.
Cycle and peaks
Conversely, the time to move from trough to peak has shortened when it was seven to eight years from 1950 to 1975, and since then it has been three to six years to peak out of the bottom of the cycle. Cattle herds peak faster while painfully taking their time to hit bottom.
Since the record inventory peak of 132 million head of cattle in 1975, each peak and trough are lower as shown in the accompanying figure. In other words, the cattle herd is progressively smaller. The most recent Cattle report pegged inventory level on Jan. 1 is now lower than the previous trough in 2014, which totaled 88.2 million head. The last peak was five years ago in 2019, which was the number of years to achieve that peak in 2019. So, with a new lower trough in the making, does the cattle inventory rebound or languish lower still?
Other factors
Cattle inventory changes for several reasons, most prominently given that the time from birth to slaughter ranges from 20 months to 36 months, depending on the time of weaning and feeding practices. Other factors can speed up the slaughter pace, such as poor margins, high-priced feed or the lack of feed, weather that is too cold or hot and other considerations.
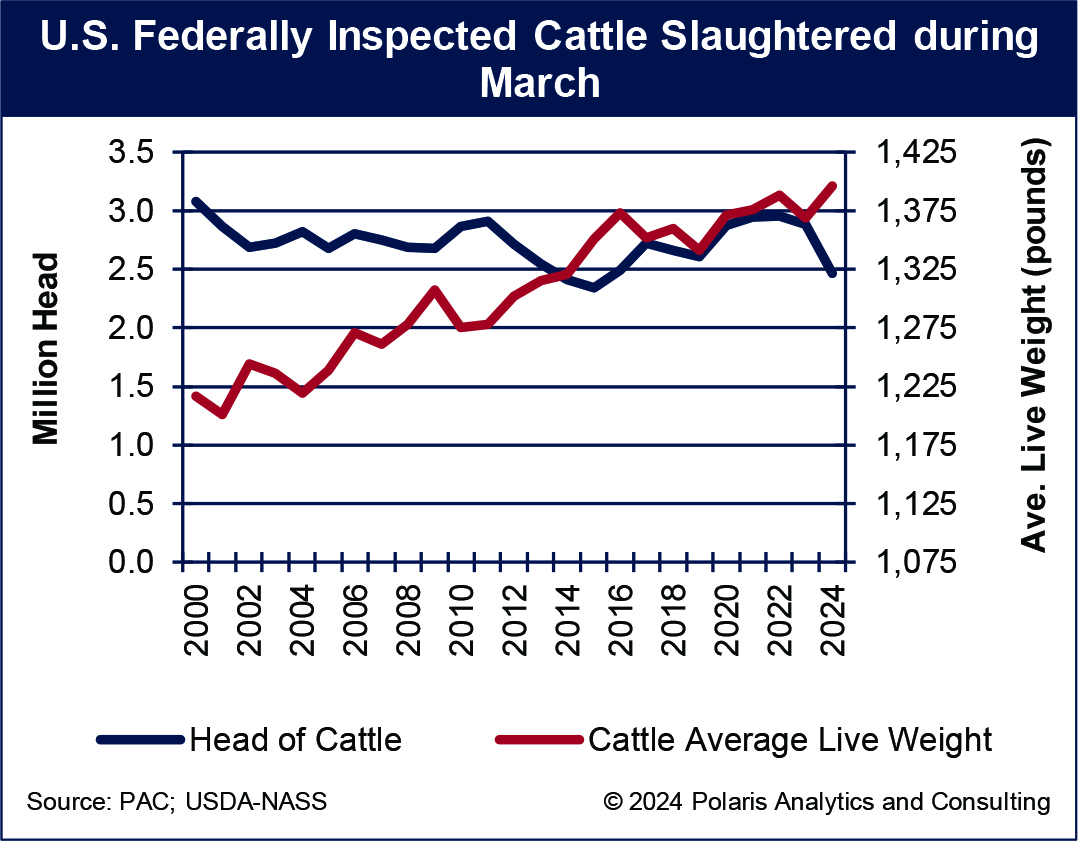
Despite the cattle herd being progressively fewer, not all is lost. The average live weight during March of each year has increased steadily since 2000, when live cattle weights averaged 1,217 pounds and for March this year were a record 1,396 pounds, an increase of 15%. (The monthly Livestock Slaughter report for March was released April 25.)
However, as much as the cattle herd has shrunk since peaking in 2019, the drop in the number of head slaughtered fell dramatically in March this year to fewer than 2.5 million head, down nearly 15% from March 2023. The number of cattle slaughtered and the average live weights for March are shown in the accompanying chart.
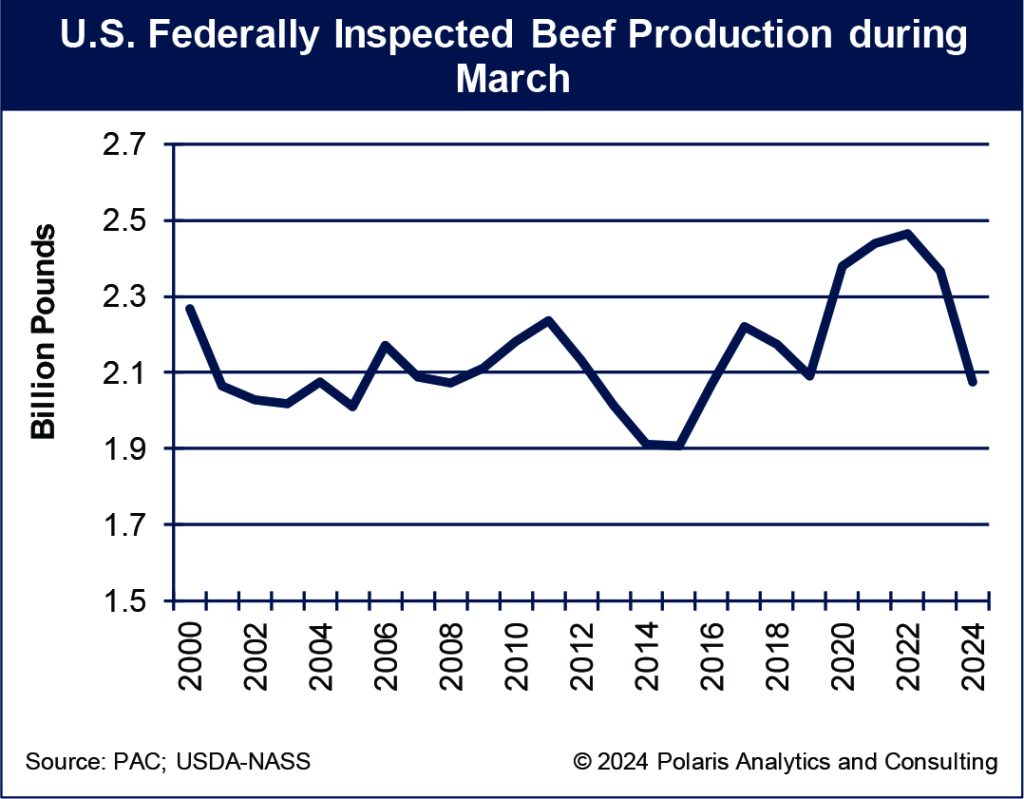
Conceivably, the increasing live weights at slaughter could offset the drop in the number of head being slaughtered. However, given the compounding impact of culling the herd over the last year, beef production during March fell 12% to less than 2.1 billion pounds, a drop of nearly 300 million pounds in one year as shown in the accompanying chart, despite the record live weights. The annual change in production was the steepest drop during March since at least 2000.
What’s possible
Is there a silver lining over the horizon? If history is our guide, and now that a new trough is in, could the climb in headcount for cattle gain traction? While calf season is underway, and the size of the calf crops of the past few years has been shrinking, the prospects of a rapid turnaround are tepid at best.
Ranchers and producers have incentives to produce larger herds with lower feed costs and higher prices for the cattle. Even if the trough is set, any peak from here will arrive fast but lower than the previous peak, if history is our guide. But with the time required to build herds and to put weight on each head, this current trough is painfully looking for the bottom as the cattle herd progressively shrinks, even though each head slaughtered is heavier.
Ken Eriksen can be reached at [email protected].
Related Articles